Reuse beats recycling.
Here is the arithmetic.
Every claim on this page has a calculation basis printed next to it. If one of them does not survive scrutiny, we would genuinely like to know — that is why the methodology is here rather than in a PDF nobody opens.
Want monthly diversion reporting?
Tell us what you have or what you need. A real person in Houston reads every one of these — usually within a couple of hours during dock time.
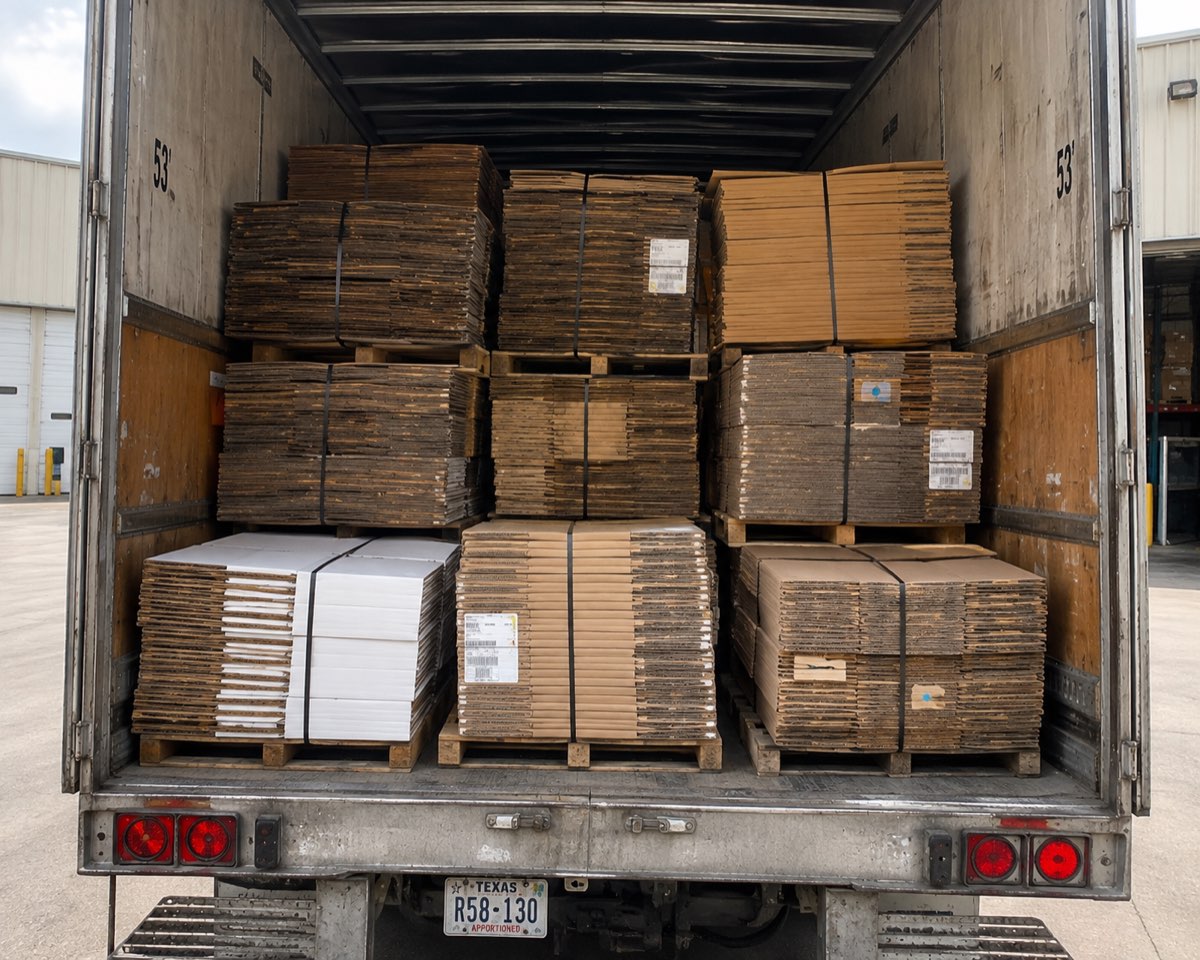
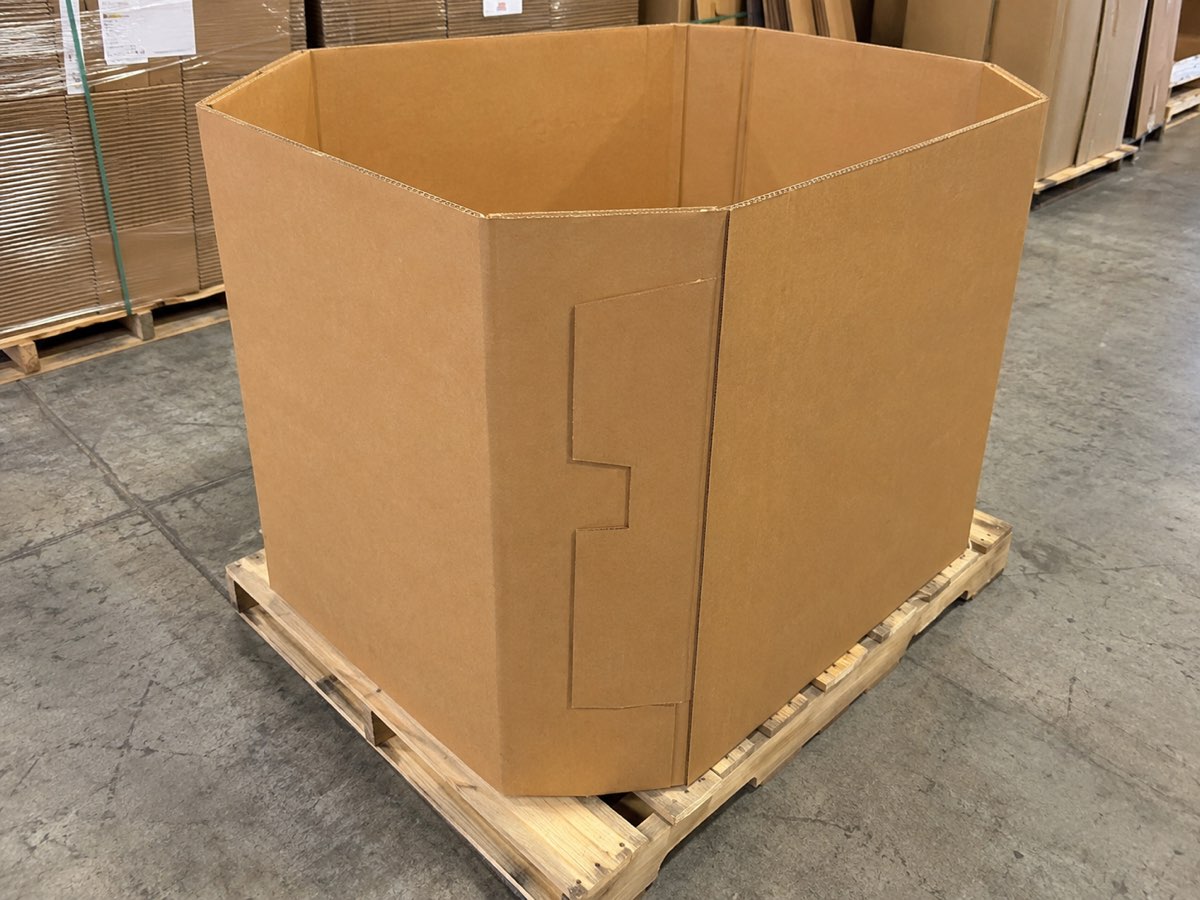
The claim, and the arithmetic behind it
Manufacturing a new tri-wall gaylord box consumes roughly 11–15 lb of fiber, several gallons of process water, and produces on the order of 13 lb of CO₂e once you account for pulping, corrugating, converting and freight to the customer. Putting an existing box back into service consumes an inspection, a repair patch and a short truck ride — call it 1.2 lb of CO₂e all-in.
That is roughly a 90% reduction, and unlike most sustainability claims it does not depend on an offset, a certificate or a projection. The box already exists. The emissions already happened. Every additional trip divides those emissions by a larger number.
What we actually measure
| Metric | Our figure | How it is calculated |
|---|---|---|
| Boxes graded per year | ~38,000 | Count at the grading line, not an estimate from weight |
| Inbound kept in service | 94% | Boxes re-graded or fabricated ÷ total boxes received |
| Fiber diverted | ~2,100 tons/yr | Certified scale tickets on baled OCC plus box mass re-deployed |
| CO₂e avoided by reuse | ~410,000 lb/yr | (13 − 1.2) lb × boxes returned to service |
| Structural fiber landfilled | 0 | Everything recoverable is graded, fabricated or baled |
| Average trips per box | 3.4 | Pool tracking across closed-loop customers |
The last row is the one we care about internally. Everything else follows from it. A programme that raises average trips per box from 2 to 4 halves the manufacturing emission attributable to each fill, halves the packaging spend, and does it without buying anything.
Where the published equivalents come from
One ton of recovered OCC saves roughly 17 trees, 7,000 gallons of water, 4,100 kWh of energy and 3.3 cubic yards of landfill volume. These are widely published industry figures and we use them as-is rather than deriving our own — using the common basis makes our numbers comparable to everyone else's, which is the point of reporting them at all.
What we do not claim
- We do not claim carbon neutrality. We run diesel trucks and a baler on grid power, and both emit.
- We do not sell offsets or apply them to our numbers. The avoided emissions above are avoided, not offset.
- We do not count boxes that pass through us on a one-way move as 'diverted' more than once.
- We do not claim 100% recycled content is achievable. Corrugated fiber survives five to seven pulping cycles; virgin fiber has to enter the system somewhere.
- We do not landfill structurally recoverable material, but genuinely contaminated fiber — wax-coated, food-soaked — goes to appropriate disposal and appears as its own line, not hidden in a blend.
Reporting for customers
Standing-route and closed-loop customers receive a monthly statement: pool size, trips per box, attrition rate and cause, tons of fiber diverted, and estimated CO₂e avoided — with the calculation methodology attached rather than summarised. Your ESG team should be able to audit it, not take our word for it.
If a number in one of our statements does not reconcile with your own data, tell us. Twice in the last three years a customer has caught an error in our attrition accounting, and both times the corrected number was worse for us. That is how it should work.
The four habits that do most of the work
- Boxes never touch bare concrete. It wicks moisture straight into the bottom board, and moisture damage is permanent even after drying.
- Knock down within 48 hours of emptying. Standing empties get crushed, get used as trash cans, and disappear.
- Cut across the top flap, never down a corner. Fifteen minutes of training on this adds roughly a trip and a half to average box life.
- Sort reusable from scrap at the moment of emptying, by the person who just looked inside the box.
None of those require buying anything. We publish them because a customer whose boxes last four trips instead of two is a better customer — they order less often, but they stay, and they send us their fiber.
Put your numbers into the calculator
Monthly consumption and average trips per box is all it needs. The basis is printed under the result so you can check it against your own assumptions.
Sustainability questions
Are used gaylord boxes actually more sustainable?
Yes, and it is not close. Manufacturing a new tri-wall box produces roughly 13 lb of CO₂e; returning an existing one to service costs about 1.2 lb. No offsets, no certificates — the box already exists.
What happens to boxes you cannot resell?
Stripped of metal and plastic, baled as OCC #11 or #12, sold to regional containerboard mills where they become new liner within three to five weeks.
How many times can a box be reused?
Three to six trips for a box that starts new and is handled well. Moisture exposure, prompt knock-down and where people cut boxes open are the three variables that matter most.
Can we use your figures in our ESG report?
Use the calculator output as an estimate and cite the basis. For anything audited, standing-route customers get monthly statements with actual pool data and full methodology attached.
Do you have certifications?
We hold no third-party sustainability certification and we are not going to imply otherwise. What we have is certified scale tickets, documented mill outlets and a published methodology — which is what an auditor actually asks for.