Impact Calculator
Reuse beats recycling by roughly an order of magnitude, and unlike most sustainability claims that one is arithmetic rather than assertion. Here is the arithmetic.
Want this reported monthly?
Tell us what you have or what you need. A real person in Houston reads every one of these — usually within a couple of hours during dock time.
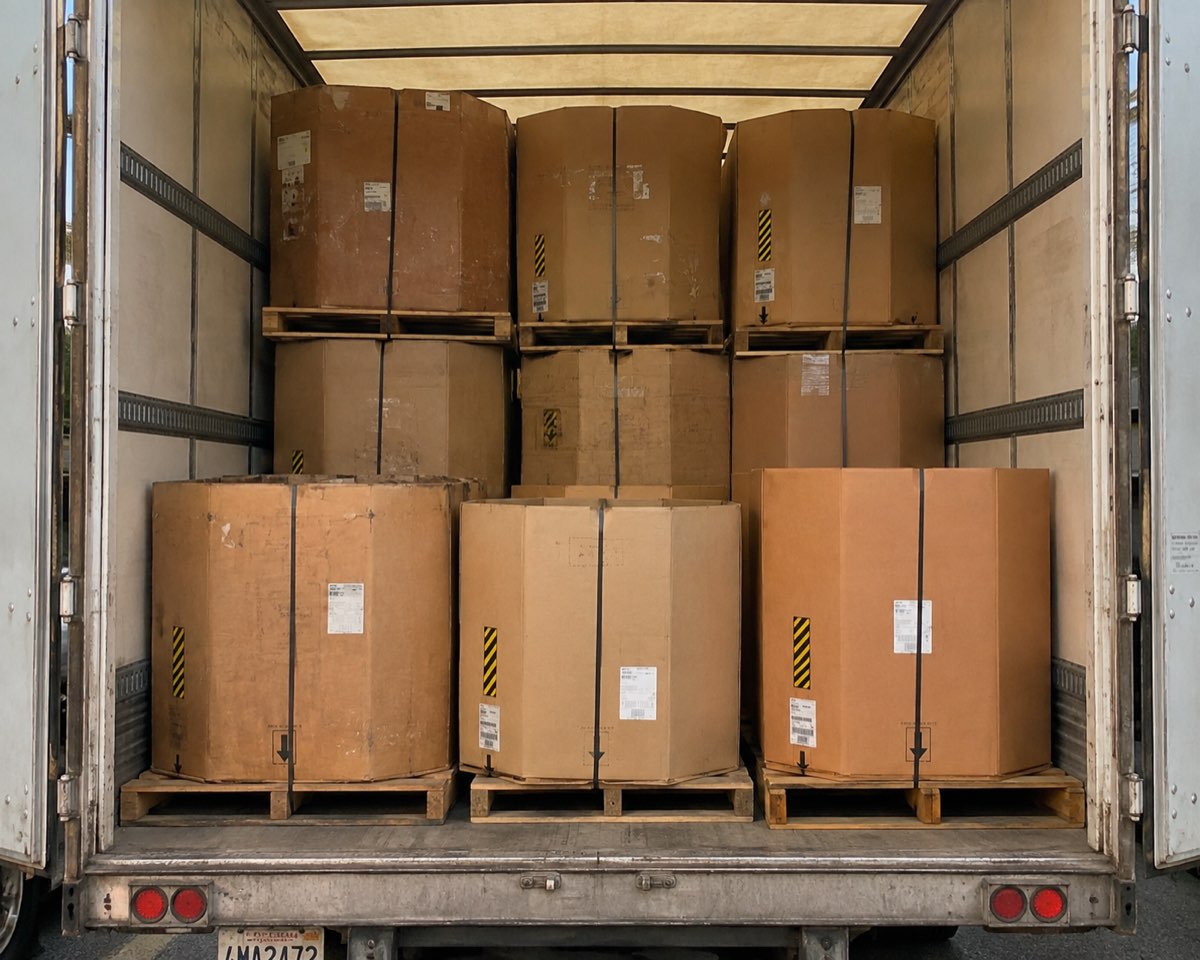
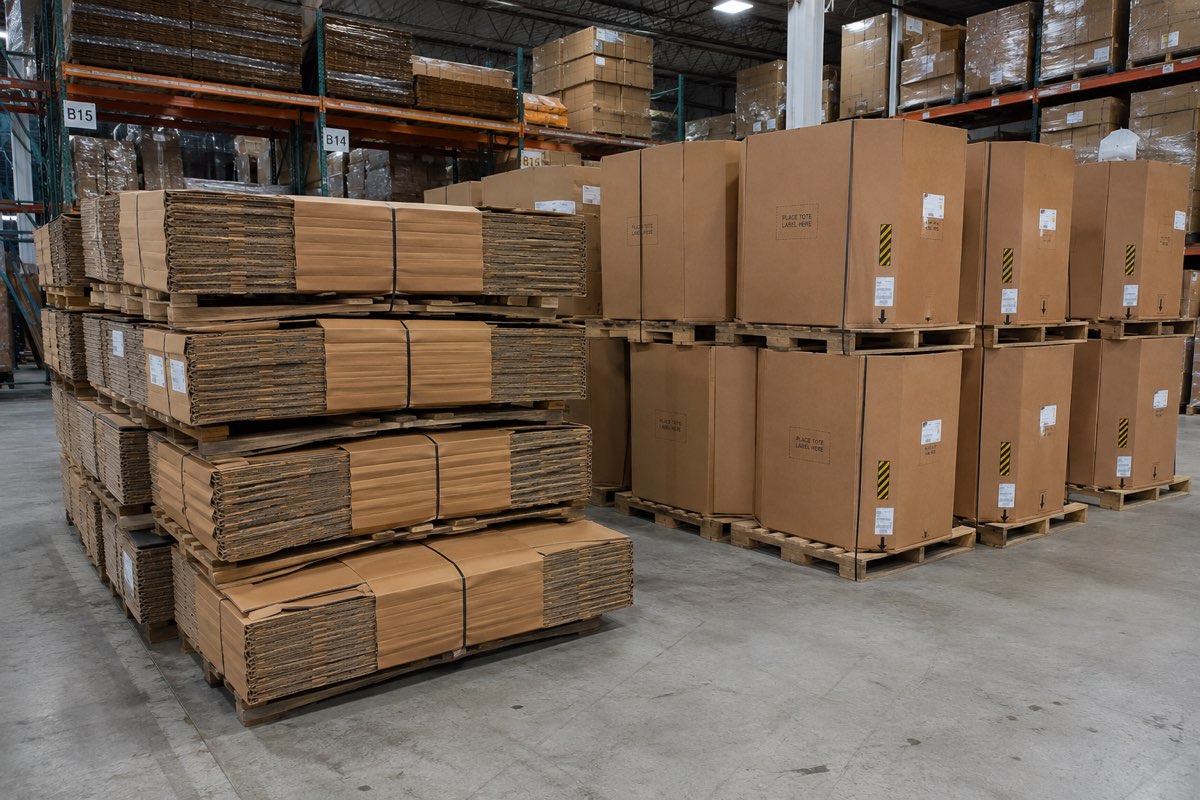
Your numbers, our arithmetic
Every figure below traces to a published basis, listed under the result. No offsets, no certificates, no projections.
61% below buying every box new, at 3 trips per box across 14,400 box-fills a year.
- Fiber kept in service
- 62.4 tons
- Equivalent trees
- 1,061
- Water not drawn
- 436,800 gal
- Energy not spent
- 255,840 kWh
Basis: new tri-wall box ≈ 13 lb CO₂e produced; a reuse cycle ≈ 1.2 lb CO₂e including inspection, repair and local freight; box mass ≈ 13 lb of fiber; one ton of recovered OCC ≈ 17 trees, 7,000 gallons and 4,100 kWh.
Where do these figures come from?
Published containerboard lifecycle ranges for pulping, corrugating, converting and regional freight, plus our own yard data on inspection, repair and local delivery for the reuse leg. The basis is printed under every result.
Why is reuse so much better than recycling?
Recycling still requires repulping, re-forming, re-converting and re-shipping — most of the manufacturing energy happens again. Reuse skips all of it for the price of an inspection and a short truck ride.
Is 'trips per box' realistic at 4 or 5?
Yes, in a well-run closed loop with dock discipline. Three to four is typical. Six is achievable with training and dry storage; boxes that touch bare concrete rarely see three.
Can I use these numbers in an ESG report?
Use them as an estimate and cite the basis. For anything audited, we provide monthly statements with actual pool data and methodology attached — that is the number that survives scrutiny.